
In this week’s ‘UK Property Market Stats Show’ for week ending Sunday, 22nd November 2024, special guest, Iain White, and I discuss the property market headlines for Week 47 of 2024.
The main headlines can be viewed below.
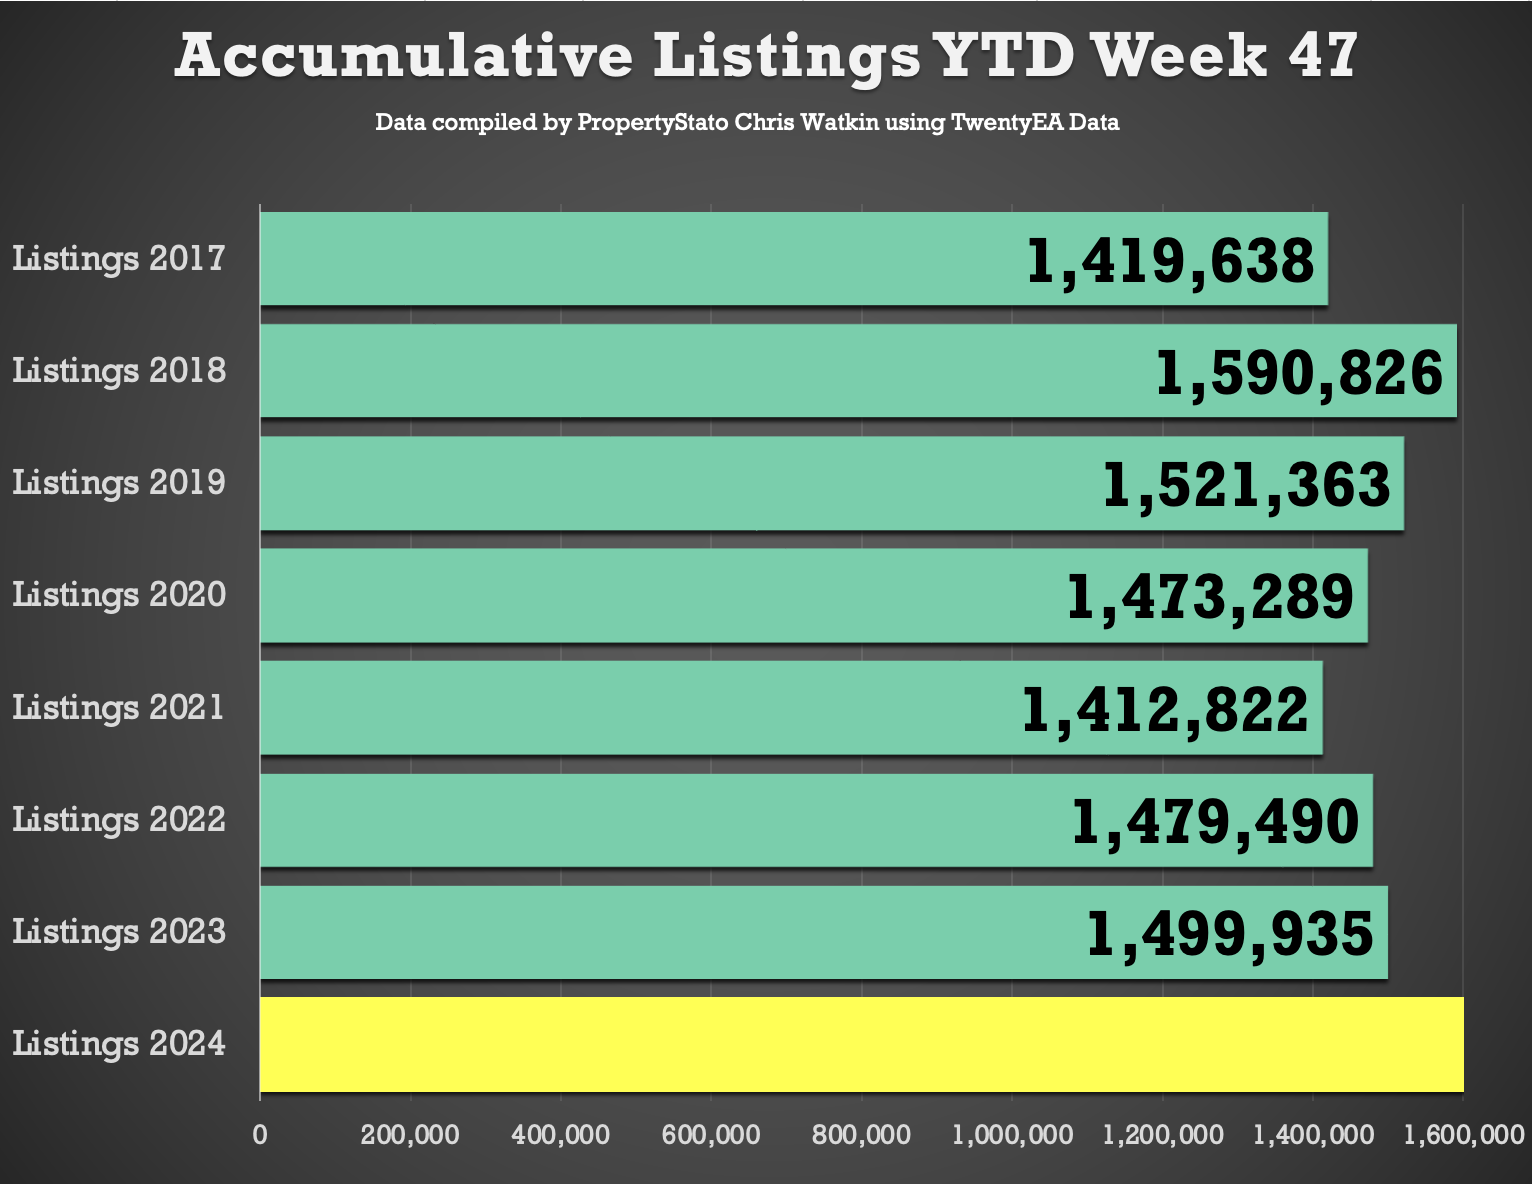
+ Listings (New properties coming on to the market) – 27.2 UK listings this week (week 47), an expected slight drop of 1.8k from last week. 8.3% higher 2024 YTD than 2023 YTD.
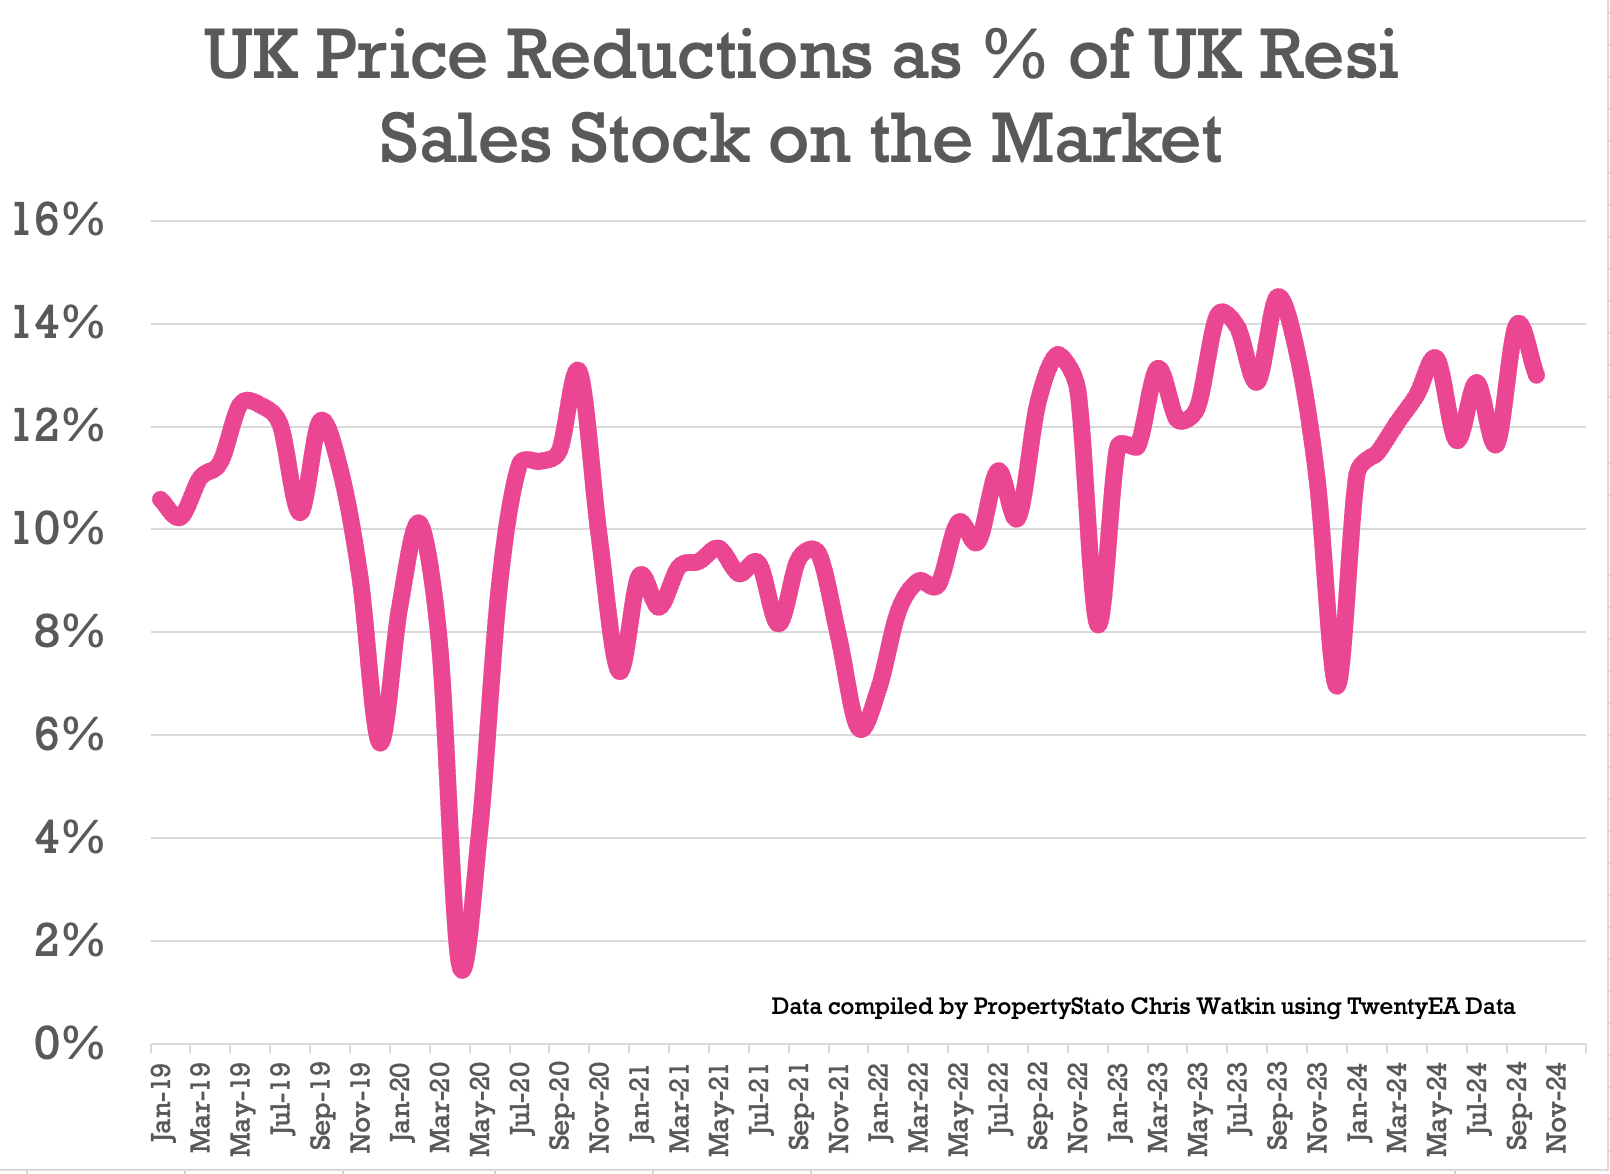
+ % of Resi Sales Stock being reduced (Monthly): 13% of Resi sales stock was reduced in the last month. 14% last month and long term 5 year average 10.6%.
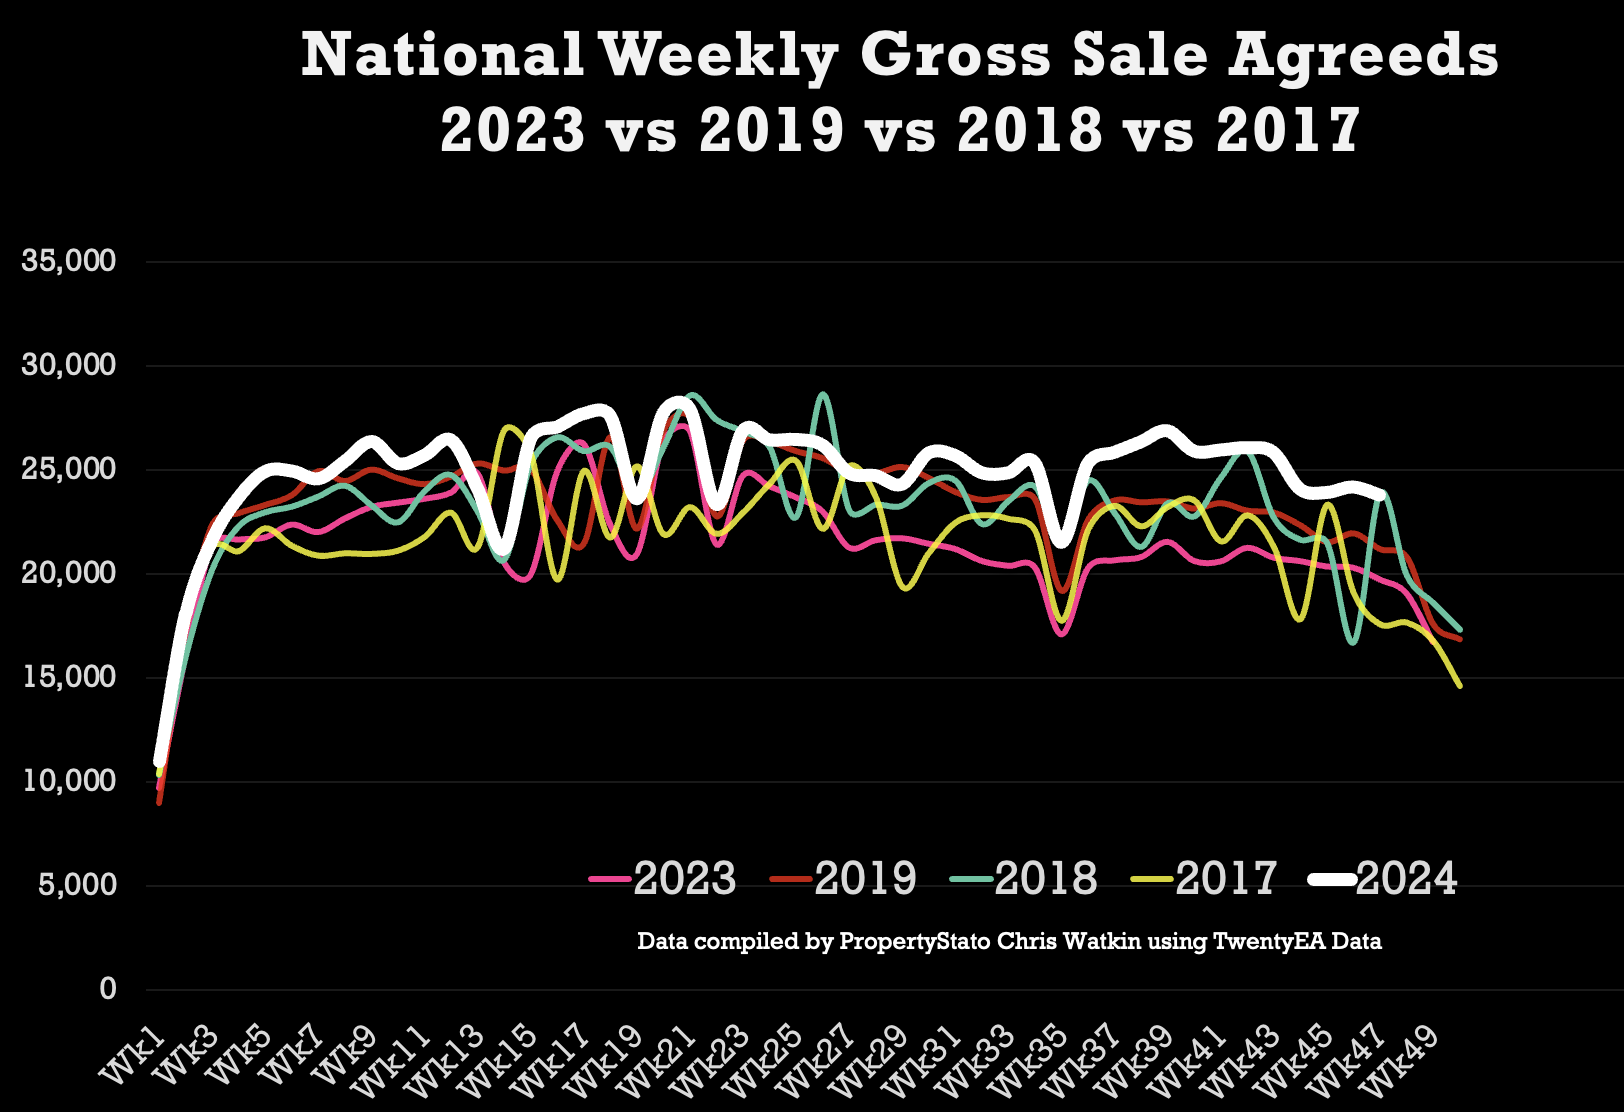
+ Total gross sales: 23.8k UK homes sold stc this week (Week 47), 1.2% lower than last week. 21% higher than the same standalone week (week 47) in 2023. Also, 8.6% higher than 2017/18/19 YTD levels & 15.1% higher than 2023 YTD levels.
+ Sale through rate (monthly): UK estate agents sold 16.11% of their resi sales stock in Oct ’24. Sept ‘ 24 was 14.79%. 2024 average is 15.86% & the 7 year long term average is 17.9% per month – yet don’t forget that was only in mid/late 20%’s in the crazy years of 20/21/22).
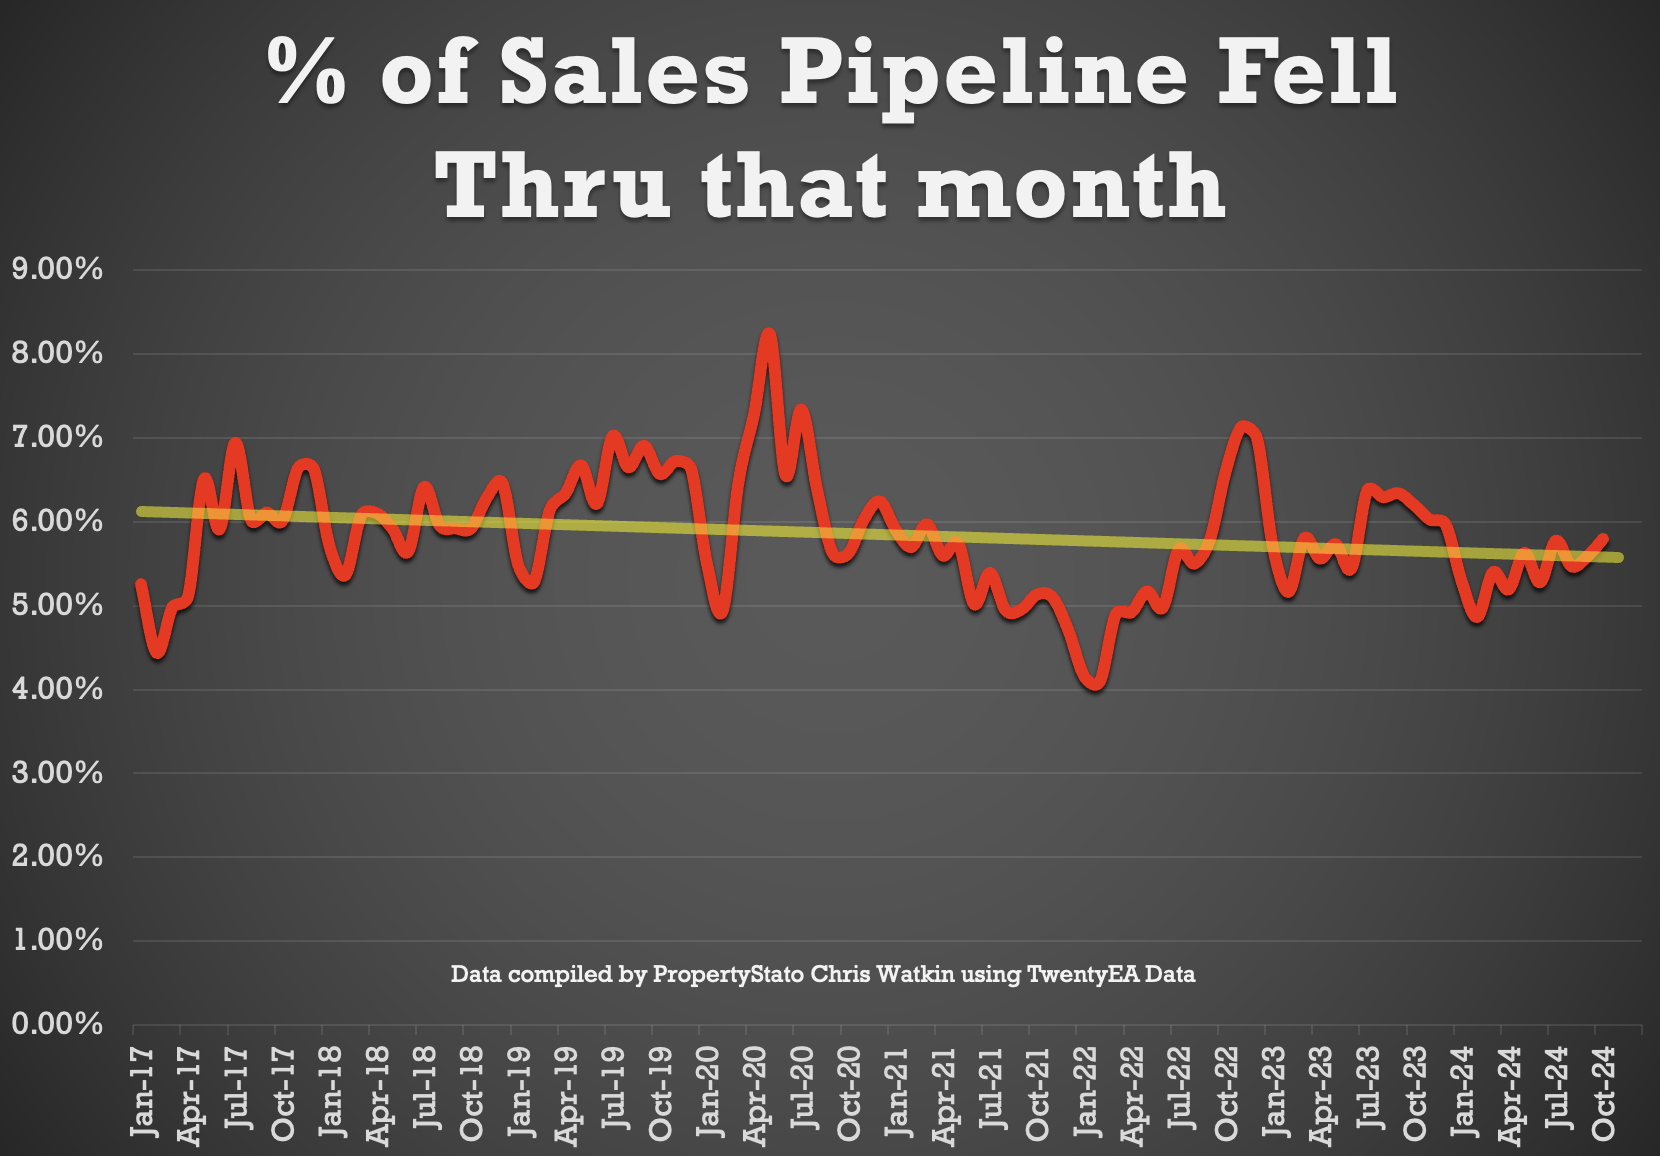
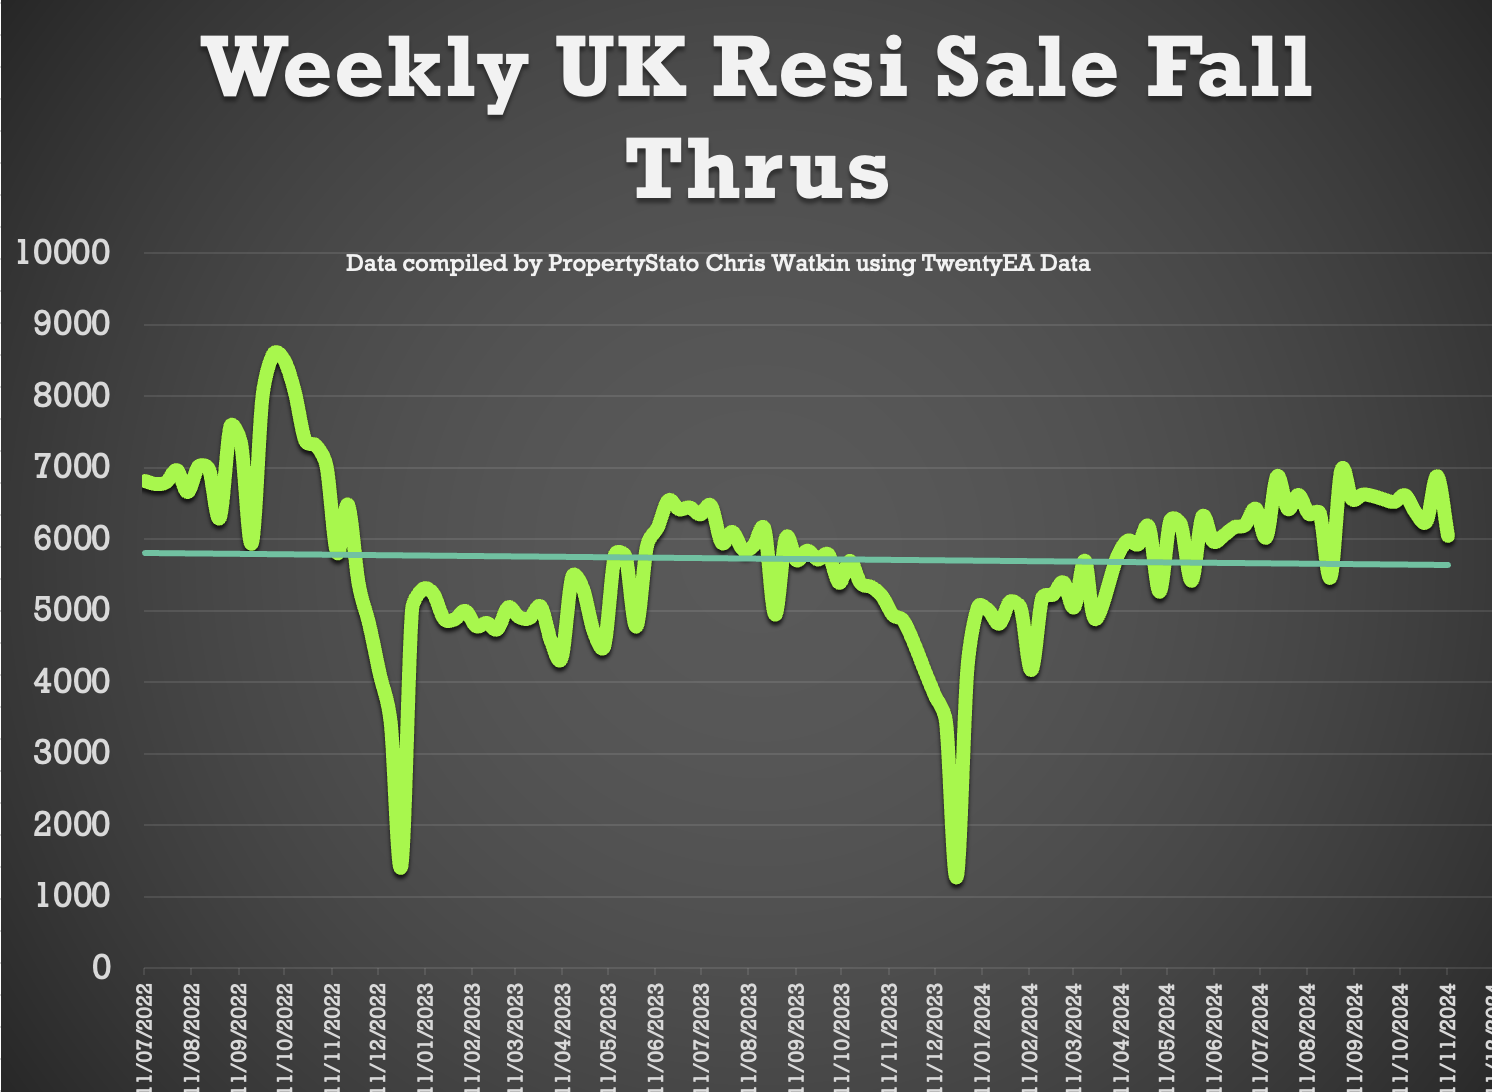
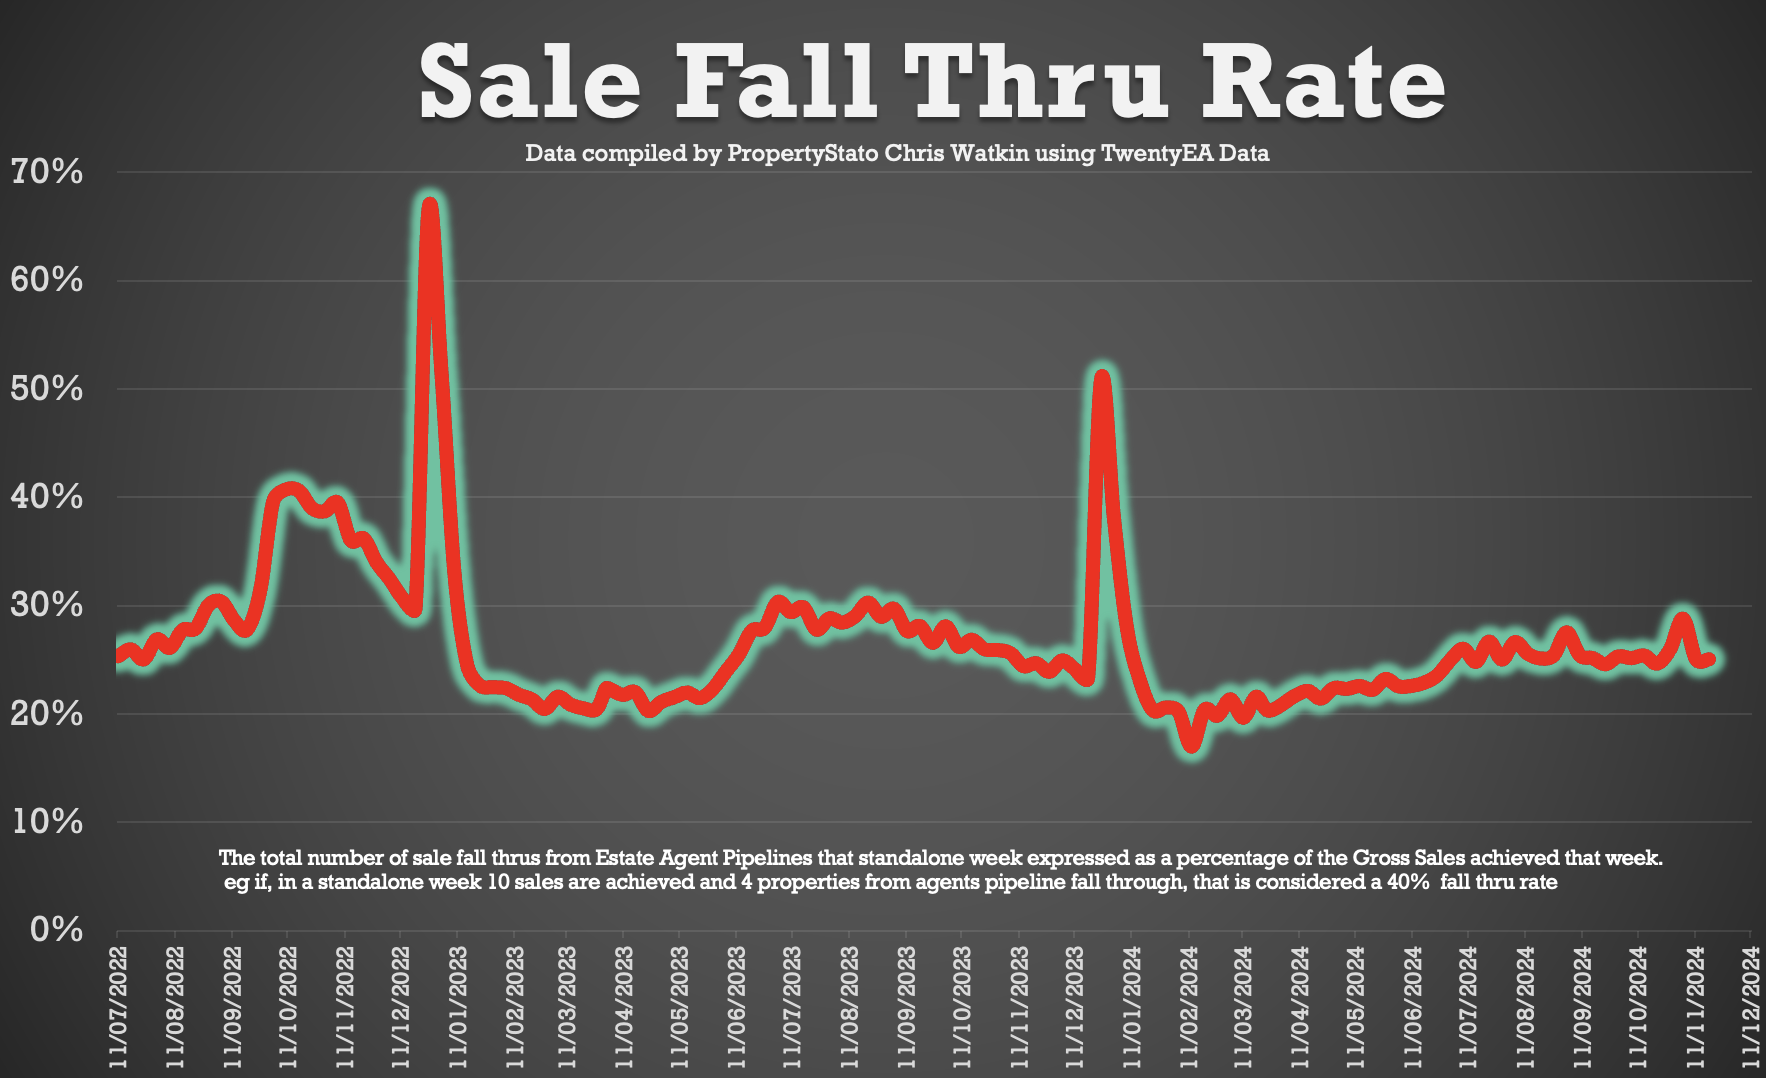
+ Sale fall-throughs: Agents lost 5.8% of their sales pipeline for the month of October (up from 5.6% in Sept ‘ 24). For week 47, sale fall-throughs (as a % of gross sales agreed) decreased 25%). The 7 year long term weekly average is 24.8% and it was 40%+ in the two months following the Truss Budget in the Autumn of 2022.
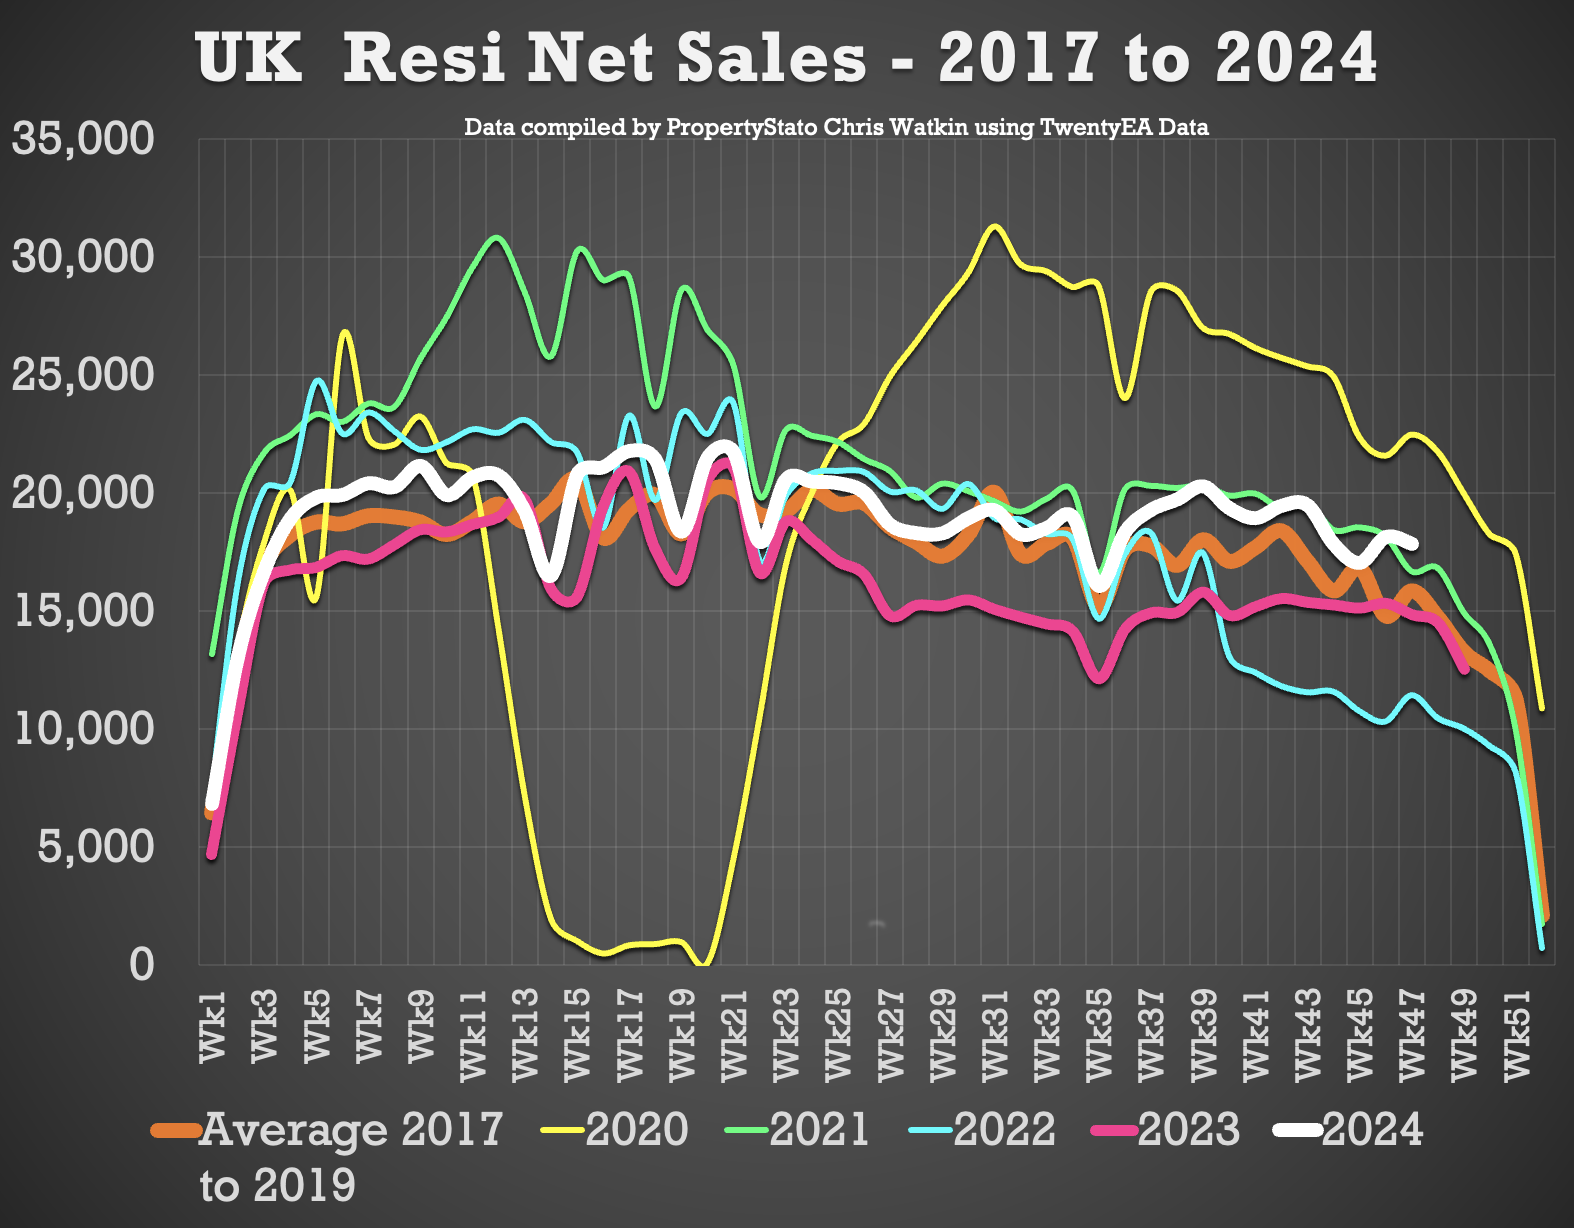
+ Net sales: 17.8k this week (average for last 4 weeks 17.7k). 20% higher than the same week 47 in 2023, 56% higher than the same week 47 in 2022 & still 17.4% higher YTD in 2024 compared to YTD 2023.

+ % of homes exchanging vs homes unsold: Of the 1,387,069 UK homes that left UK estate agents books since the 1st Jan 2024, 743,269 of them (53.59%) exchanged & completed contracts (meaning the homeowner moved and the estate agent got paid). The remaining 643,800 (46.41%) were withdrawn off the market, unsold. In essence you do a flip of the coin chance of actually selling, homeowners moving and the estate agent getting paid.
+ UK house prices: As explained in the show, the £/sqft figure foretells and predicts the Land Registry 5 months in advance with an accuracy rating of 92%. Final October figures saw a slight jump in this important metric to £346/sq.ft. For comparison, Sept’s £339/sq.ft, August’s £338/sq.ft, and July at £341/sq.ft. This means house prices are slightly growing.
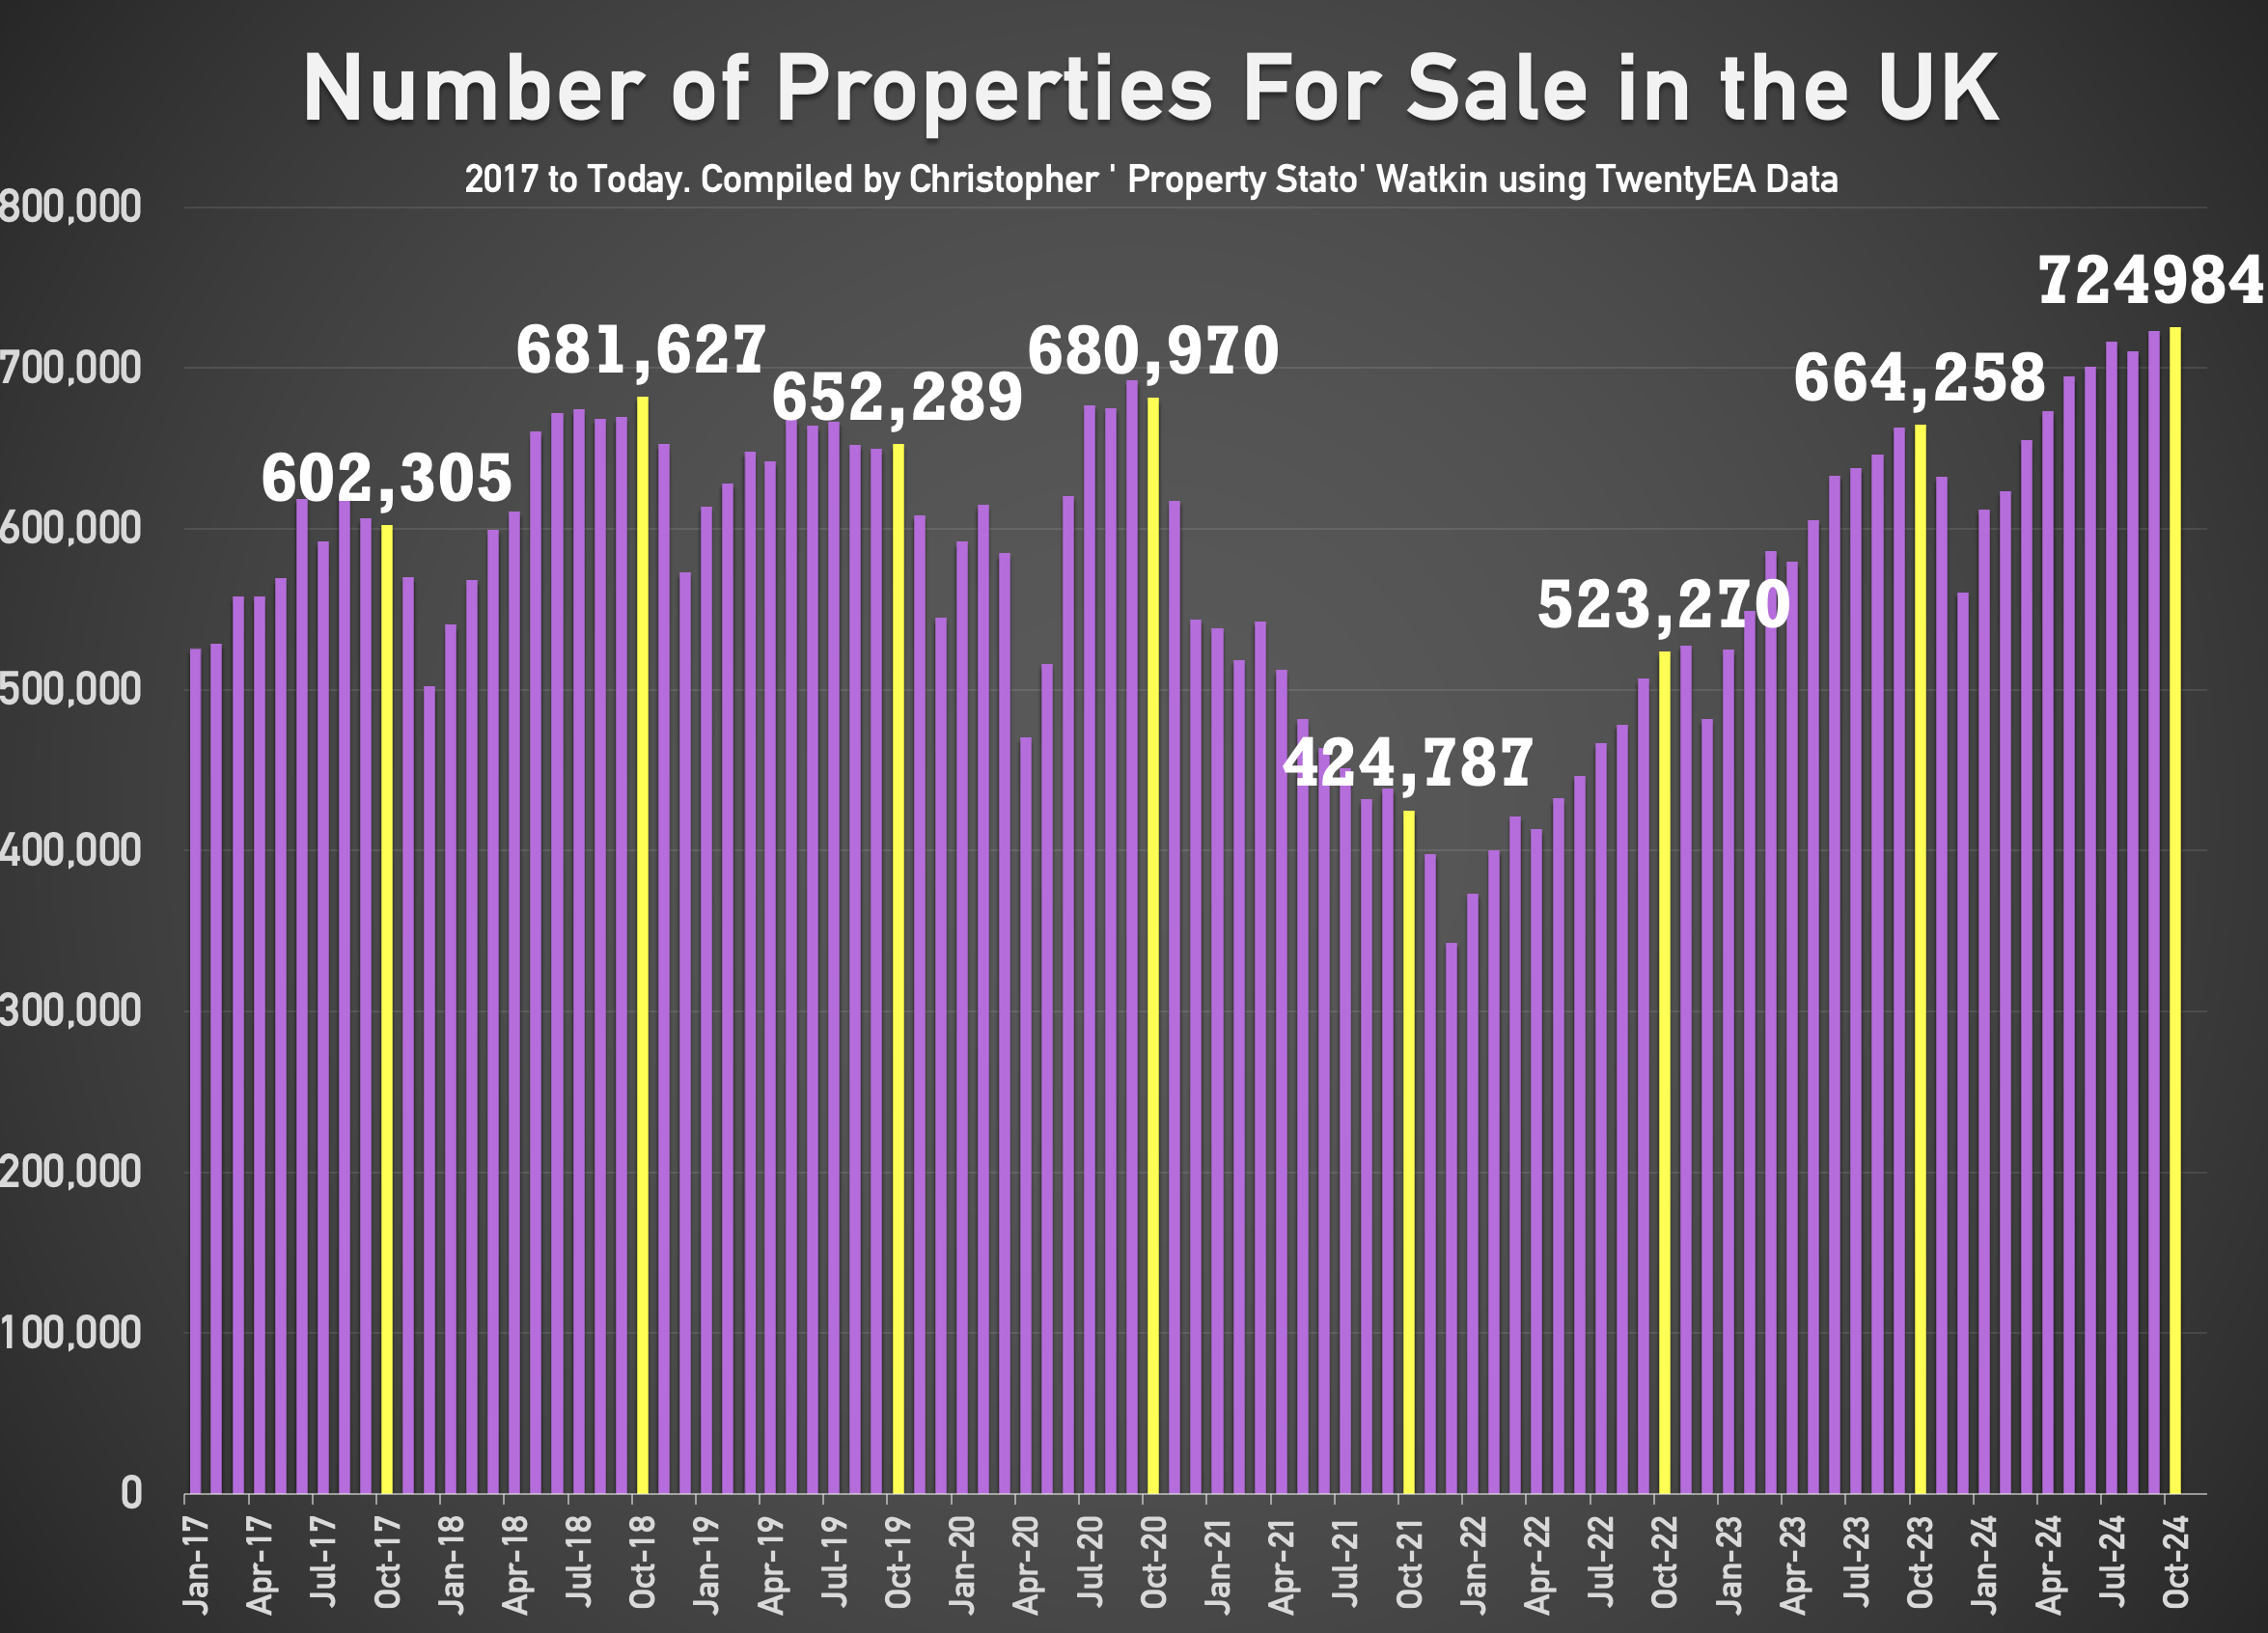
+ Resi sales stock on the market (monthly stat): 725k at end of October (up from 724k at end of Sept). For comparison, Oct ’23 664k, Oct ’22 523k, Oct ’21 425k, Oct ’20 681k, Oct ’19 652k.
+ Resi sales sold STC pipeline (units) (monthly stat): 505k at end of October. For comparison, Oct ’23 401k, Oct ’22 483k, Oct ’21 528k, Oct ’20 548k, Oct ’19 372k.

Local focus this week is Banbury.


