
This week, I am joined by the experienced agent Toby Martin as we delve into the key property market headlines for 10th week of 2025 ending on the 16th March 2025.
UK Property Market Highlights this week
.
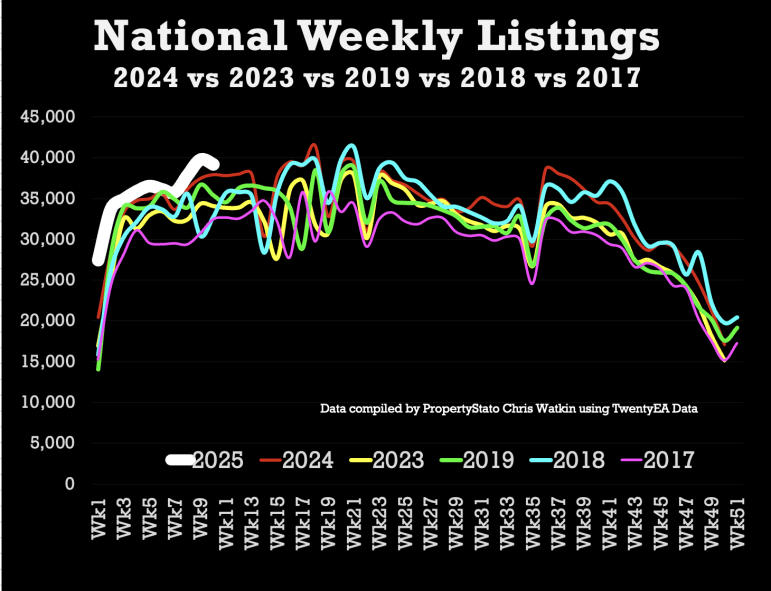
✅ Listings (New Properties on the Market)
39.2k new listings this week (last week 39.8k). That’s 7% higher than Week 10 of 2024 YTD and 10% higher YTD compared to 2017/18/19.
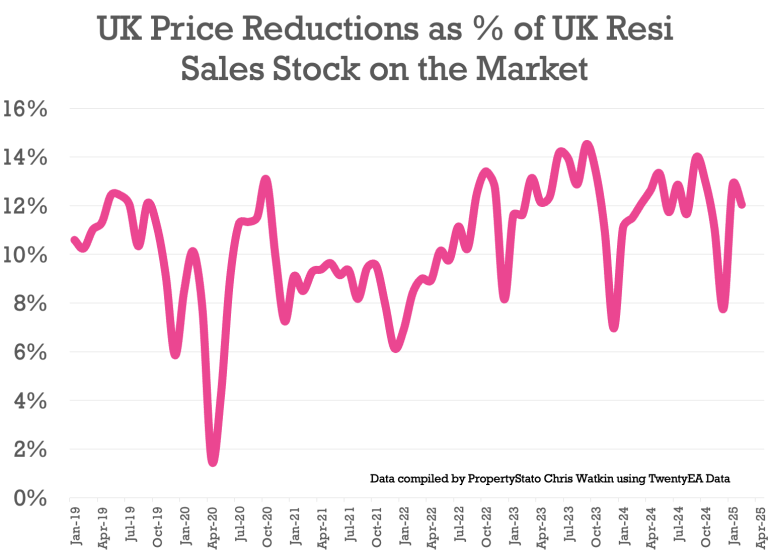
✅ Price Reductions (% of Resi Stock)
24k Price Reductions this week – meaning an approx. run rate of one in eight of residential property sales stock per month is being reduced (12%).
For comparison, 12.1% average in 2024, though the long-term five-year average is 10.6%.
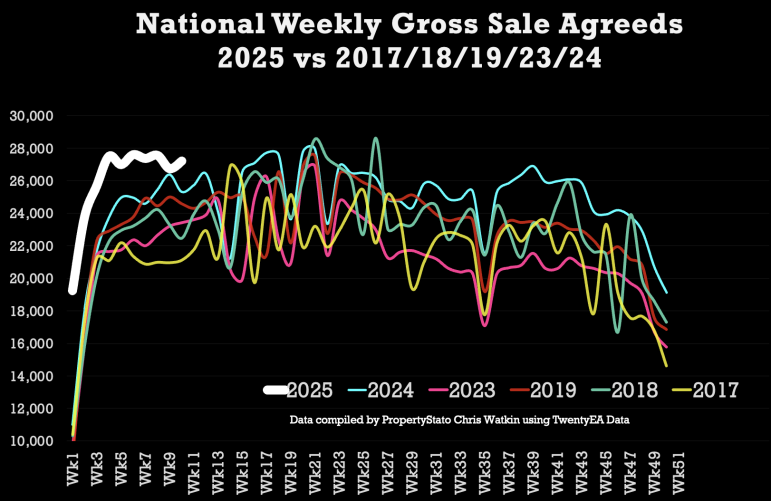
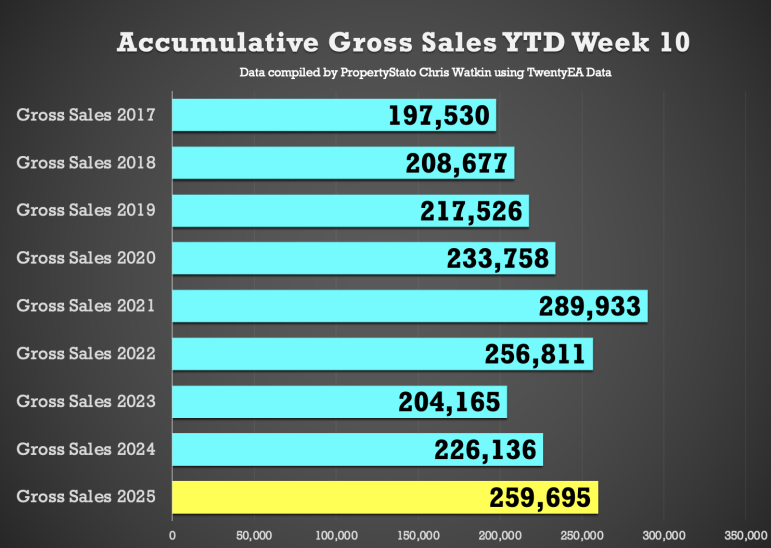
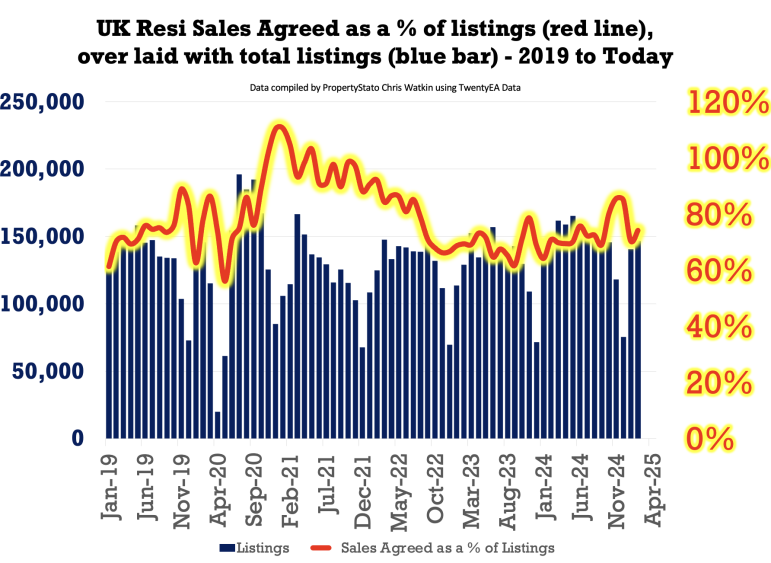
✅ Total Gross Sales (Agreed Sales)
27.2k UK homes sold STC this week, slightly up from 26.7k last week in Week 9. That’s 15% higher YTD compared to 2024 and 25% higher than 2017/18/19 YTD levels.
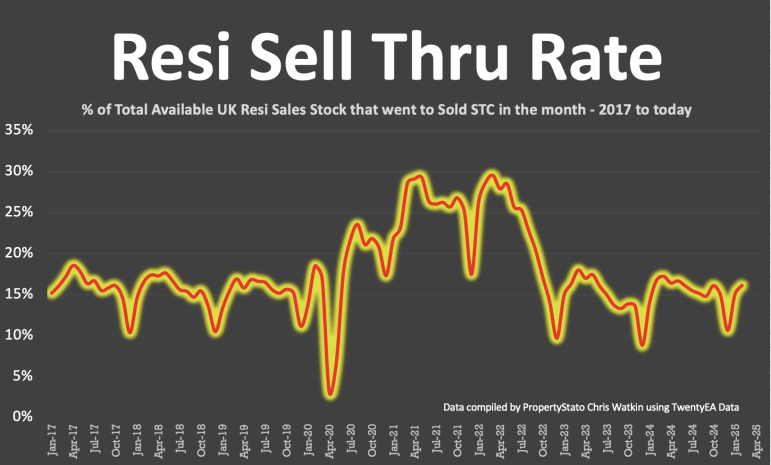
✅ Sell-Through Rate (Monthly in Arrears)
February’s run rate of 16.2% of residential property stock sold STC (i.e. 16.2% of Estate Agents properties on the market went sale agreed in February). For comparison, 16.7% of residential sales stock sold in February 2024. 2024 monthly average: 15.3%. Long-term 8-year average: 17.9%.
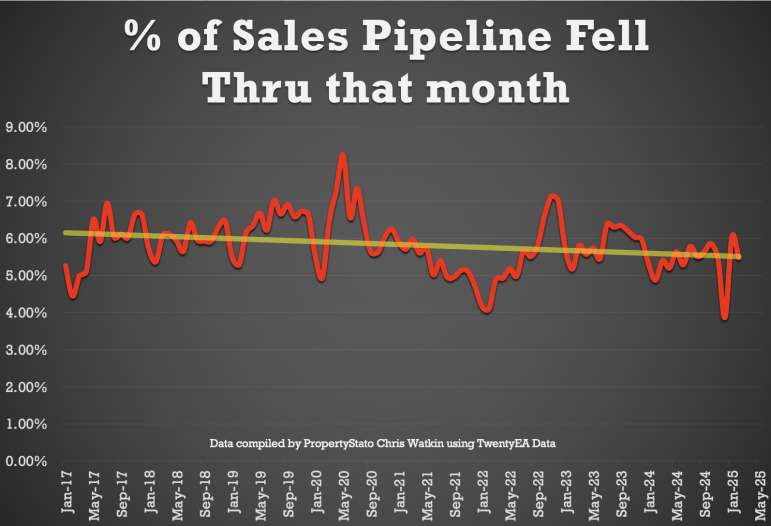
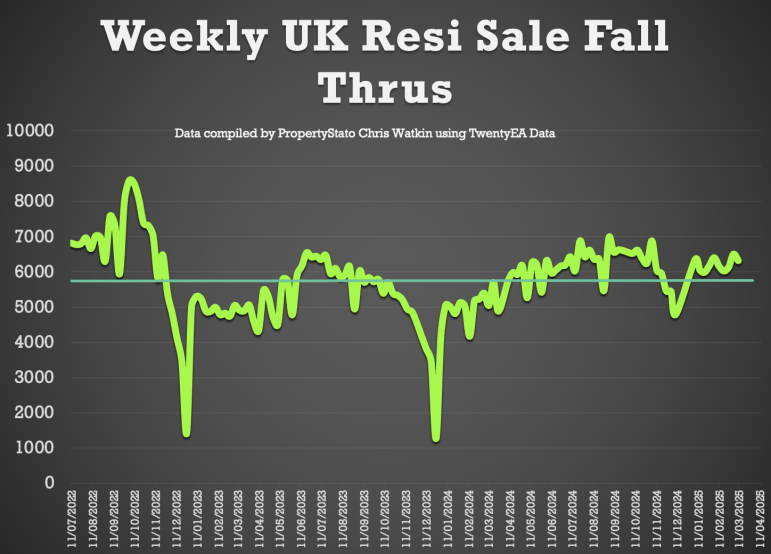
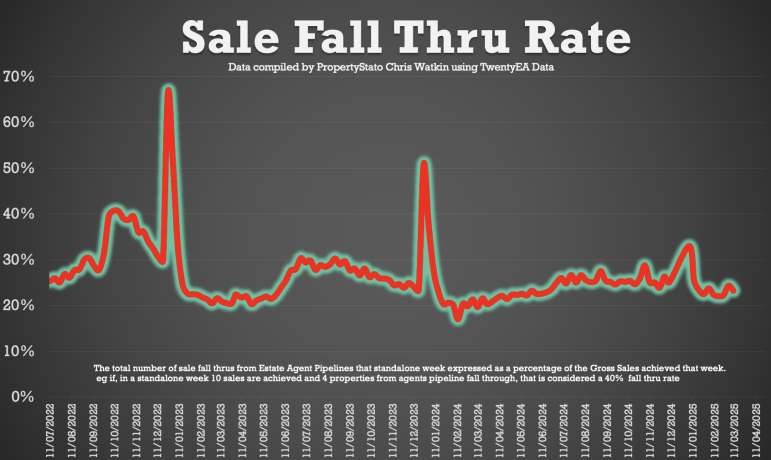
✅ Sale Fall-Throughs
6,319 Sale fall-thrus last week from Resi Sale Sales Pipeline of 451,074 homes sale agreed (sold stc).
Another method is that week’s sale fall thrus as a % of gross sales that week. This week, that is 22.3% (last week 24.3%). Just above the 7-year average of 24.2%, yet well below the 40%+ levels post-Truss Budget (Autumn 2022).
For February ’25 as a whole, 5.48% of sales in the UK agents pipelines fell thru in Feb 25. For comparison, 2024 average: 5.36%.
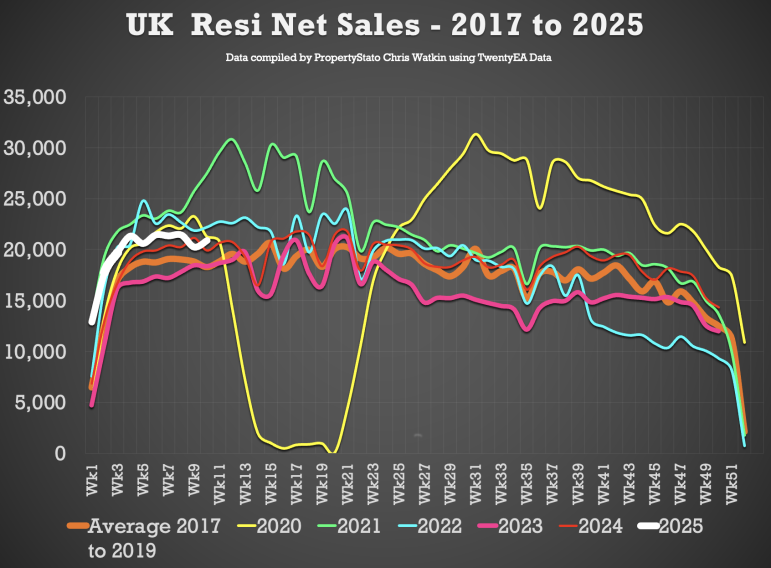
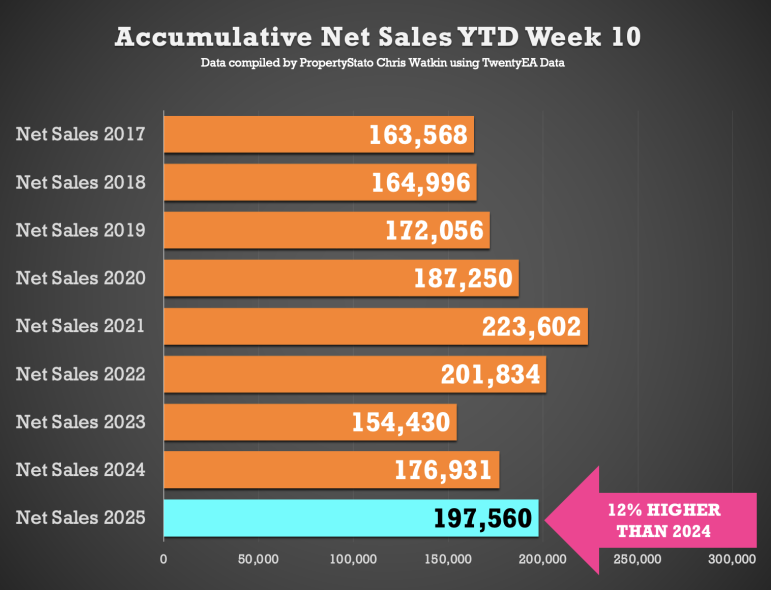
✅ Net Sales (Gross sales for the week less Sale Fall Throughs for the week)
20.9k net sales this week (20.2k last week), compared 2025 weekly average of 19.7k.
2025 YTD is 12% higher than compared to 2024 YTD and 18% higher than YTD 2017/18/19.
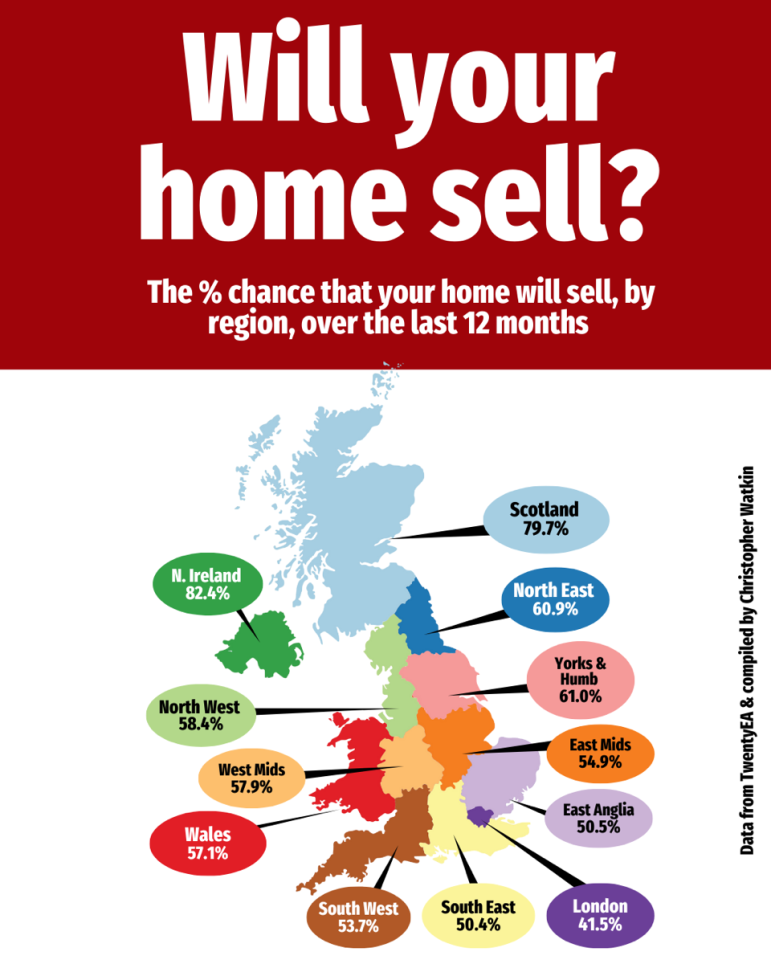
✅ Overvaluing
54% of properties that left Estate Agents books in the last 12 months, did the property exchange contracts (and the estate agent got paid and the vendor moved) – the remaining 46% left estate agents books withdrawn. The chart with the UK map shows the regional breakdown in the last 12 months and the with the pink bar chart shows the monthly UK breakdown to 2019
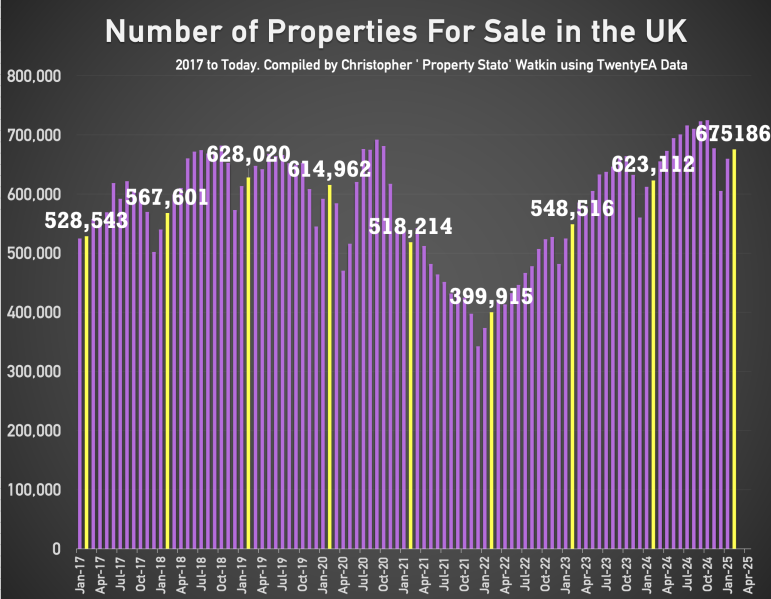
✅ Residential Sales Stock on the Market
675k properties on the market on the 1st March 2025 (monthly stat taken on the first day of the month).
Historical comparison for 1st march :
2024: 623k
2023: 548k
2022: 399k
2021: 518k
2020: 614k
2019: 628k
2018: 567k
2017: 528k.
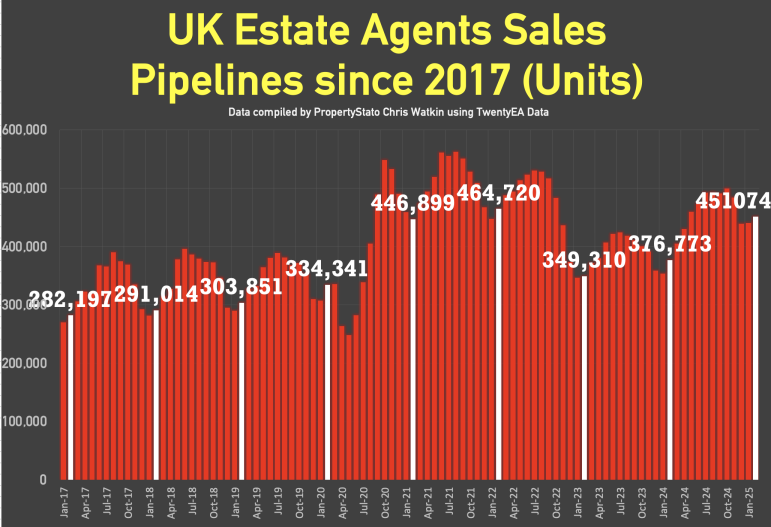
✅ Residential Sales Sold STC Pipeline
451k sales agreed in Estate Agents Sales Pipeline (ie sold stc but not yet completed) as at the 1st March 2025 (monthly figure)
Historical comparison for 1st March :
2024: 376k
2023: 349k
2022: 464k
2021: 446k
2020: 334k
2019: 303k
2018: 291k
2017: 282k.
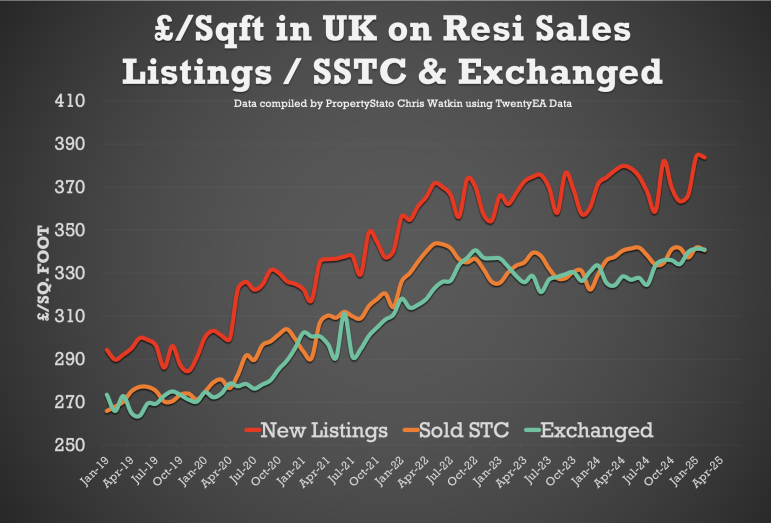
✅ UK House Prices (£/sq.ft)
As always, the £/sq.ft metric predicts Land Registry figures 5 months in advance with 92% accuracy (the orange line of the graph).
February’s final figure: £340/sq.ft.
January ’25 : £342/sq.ft
December ’24 : £339/sq.ft
August ’24: £334/sq.ft
February ’24: £335/sq.ft
This means UK house prices achieved in Feb ’25 were 0.39% lower than Jan 25, yet 1.64% higher than a year ago (Feb 24).
Local Focus this week – King’s Lynn


