
Welcome to the 39th UK Property Market Stats Show of 2025, your weekly TV programme on the UK housing market.
This week, I’m joined by Kristian Stott, a leading former estate agent and now PropTech guru, as we unpack the key headlines from week ending Sunday 5th October 2025).
✅ New Listings
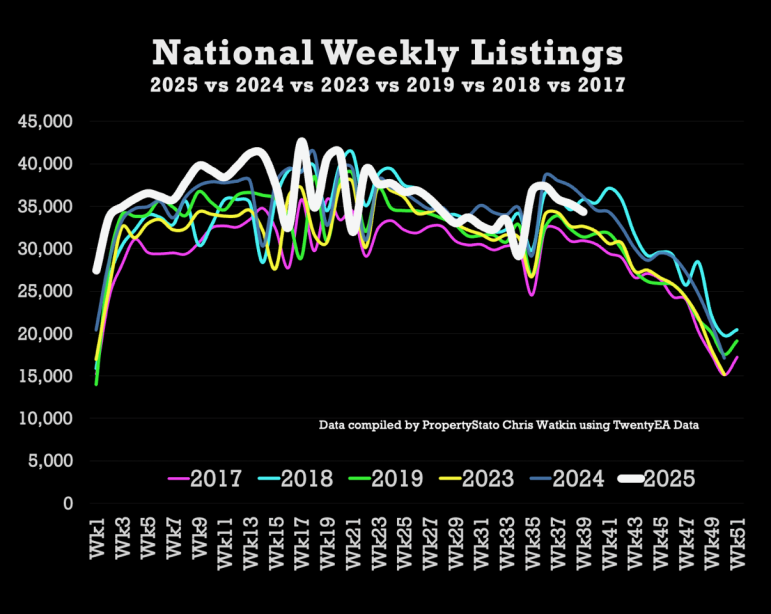
34.3k new properties came to market this week, down as expected from 35.3k last week.
2025 weekly average: 36.2k.
Nine year week 39 average :34.3k
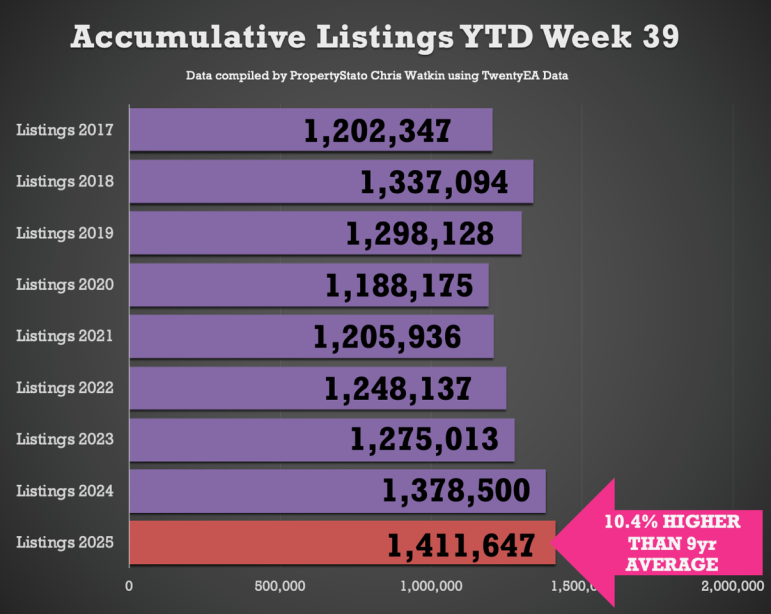
Year-to-date (YTD): 1.41m new listings, 2.4% higher than 2024 YTD (1.38m) and 10% above the 2017–19 average (1.28m).
✅ Price Reductions
25.6k reductions this week, slightly higher to last week at 25k.
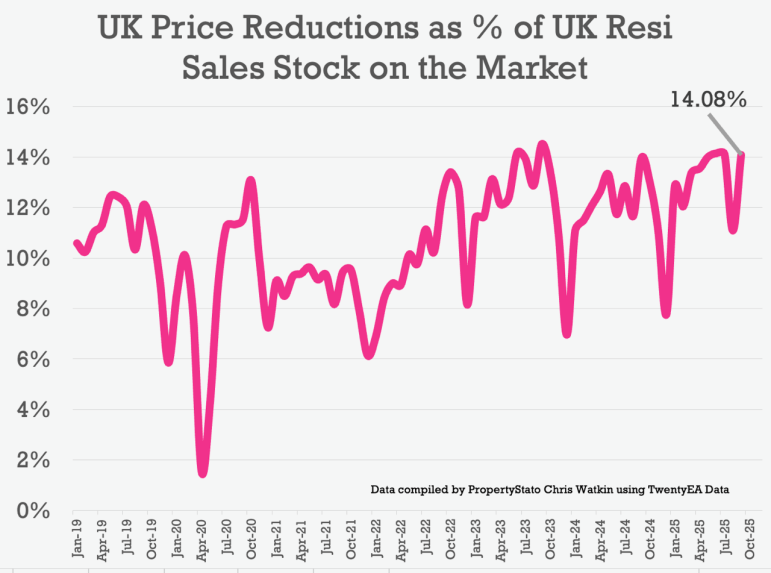
Increase in the number of homes on the market being reduced in September to 14.1%. In August, it was 11.1% (everyone must have been on holiday!), whilst it was 14.1% in July and 14% in June.
2025 average so far: 13.2%, versus the five-year long-term average of 10.74%.
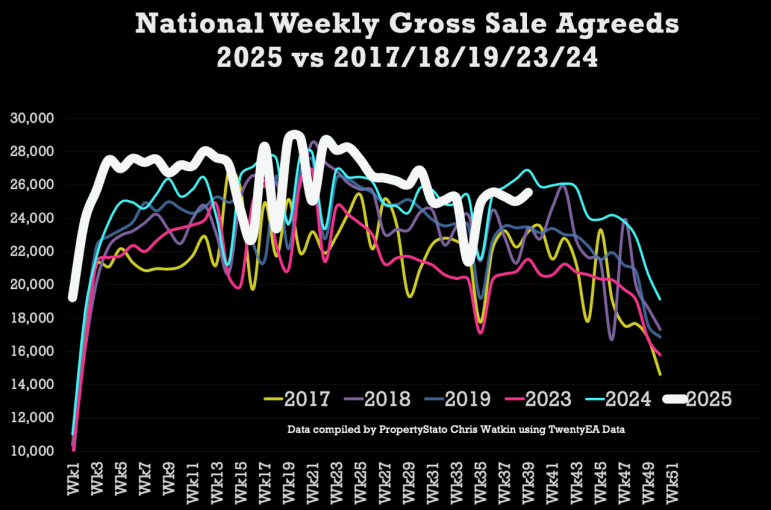
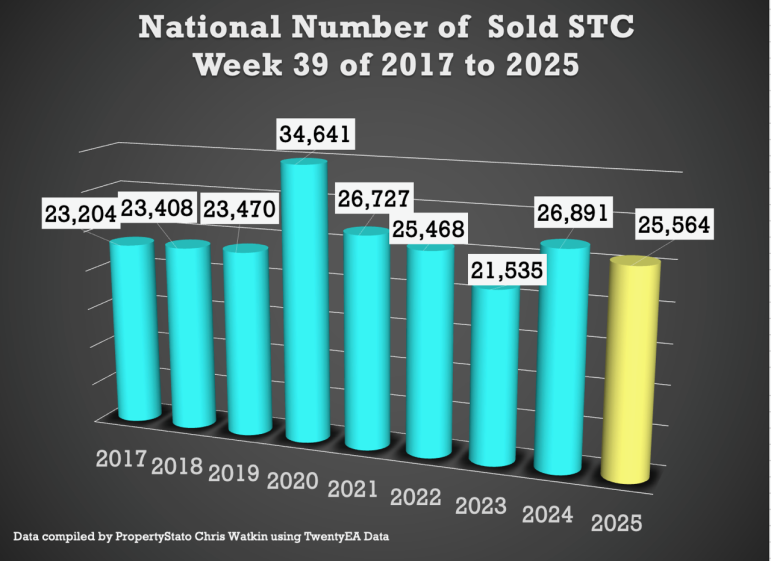
✅ Sales Agreed
25.6k homes sold subject to contract this week, up from 25k last week.
Week 39 average (for last 9 years) :25.7k
2025 weekly average : 26.1k.
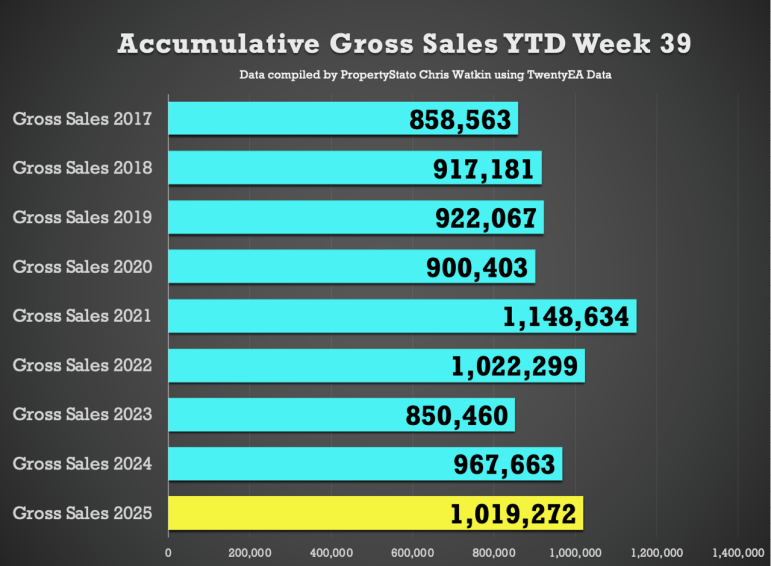
YTD: 1.019m gross sales, which is 5.3% ahead of 2024 (968k) and 13.3% above the 2017–19 average (899k).
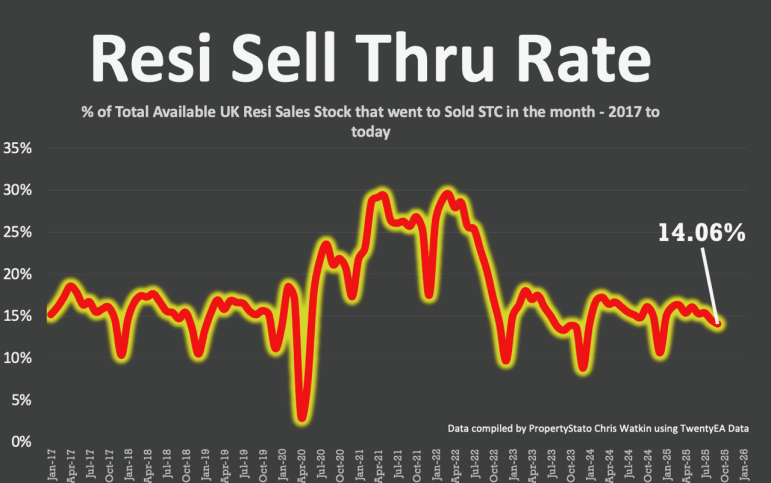
✅ Sell-Through Rate
14.1% of homes on agents’ books went SSTC in September.
Down from 14.5% in Aug, 15.4% in July, 15.3% in June, and 16.1% in May.
Pre-Covid average: 15.5%.
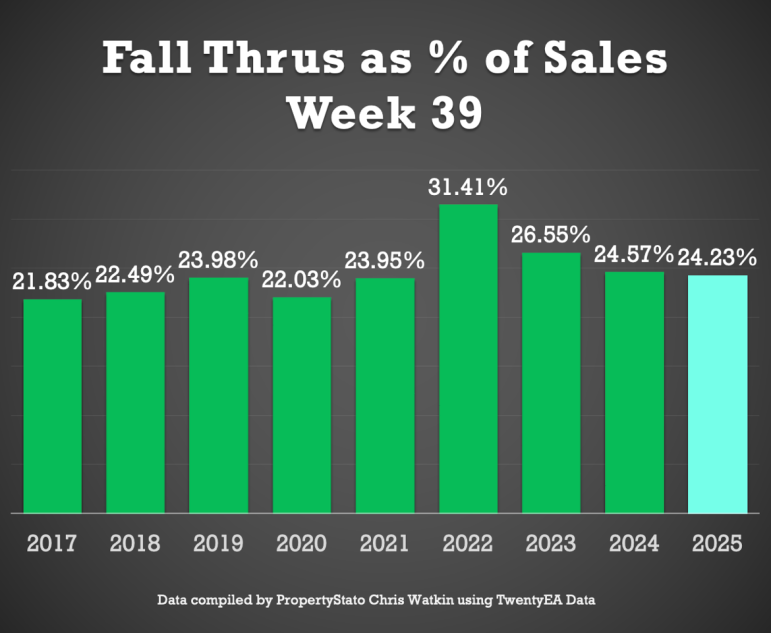
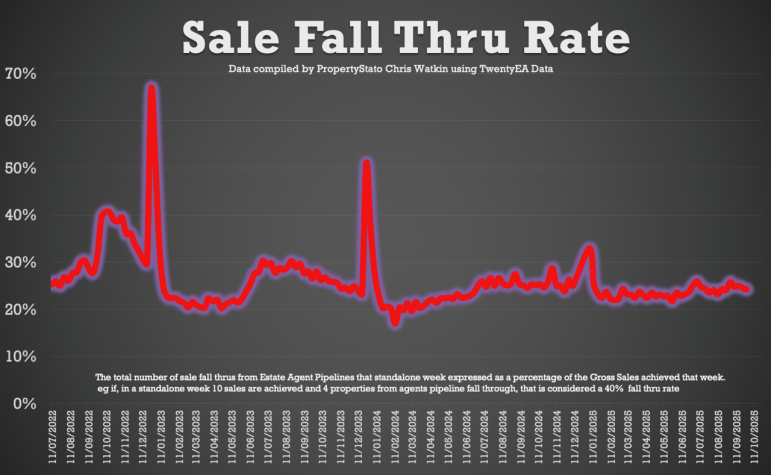
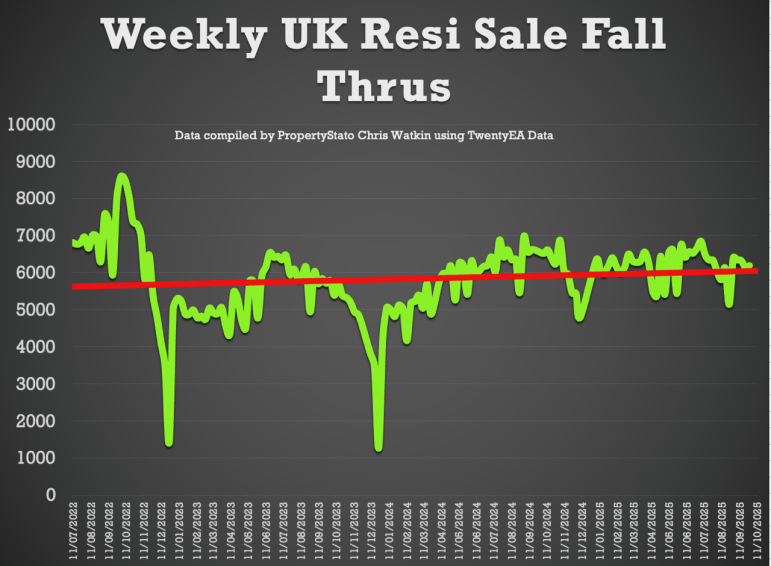
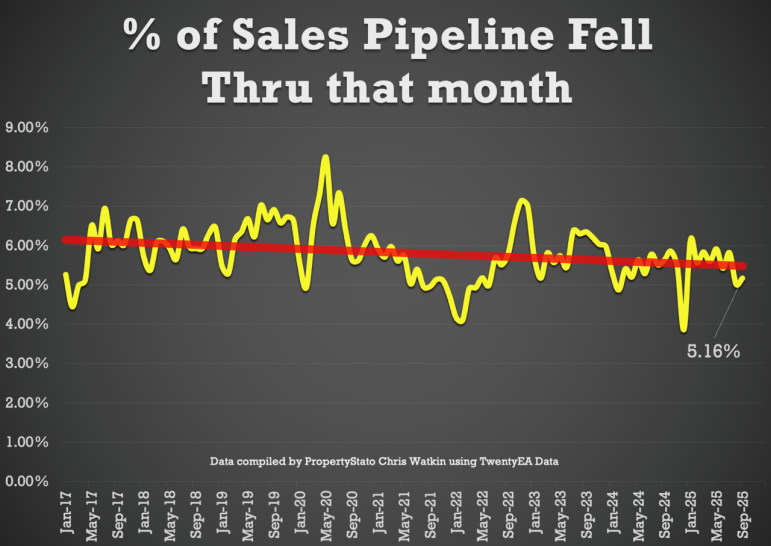
✅ Fall-Throughs
6,149 fall-throughs last week (pipeline of 510k home Sold STC).
Weekly average for 2025: 6,217.
Fall-through rate: 24.6%, down from 25% last week.
Long-term average: 24.2% (post-Truss chaos saw levels exceed 40%).
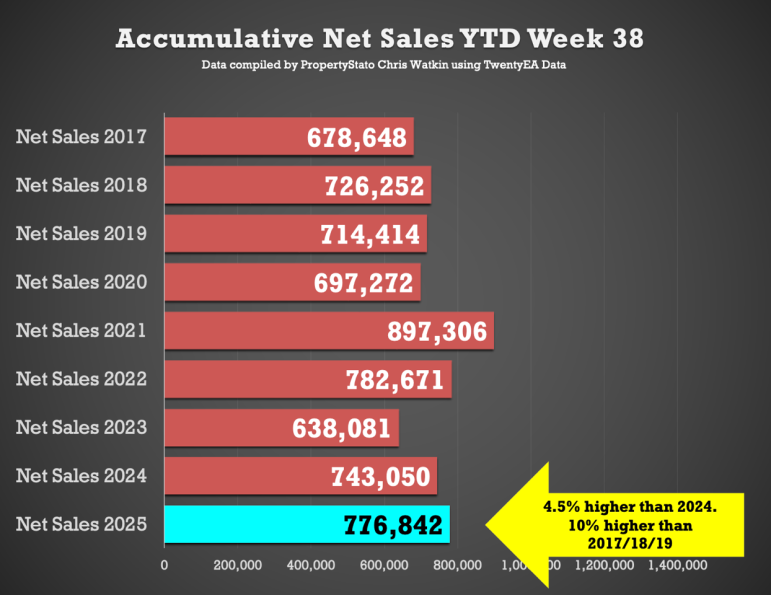
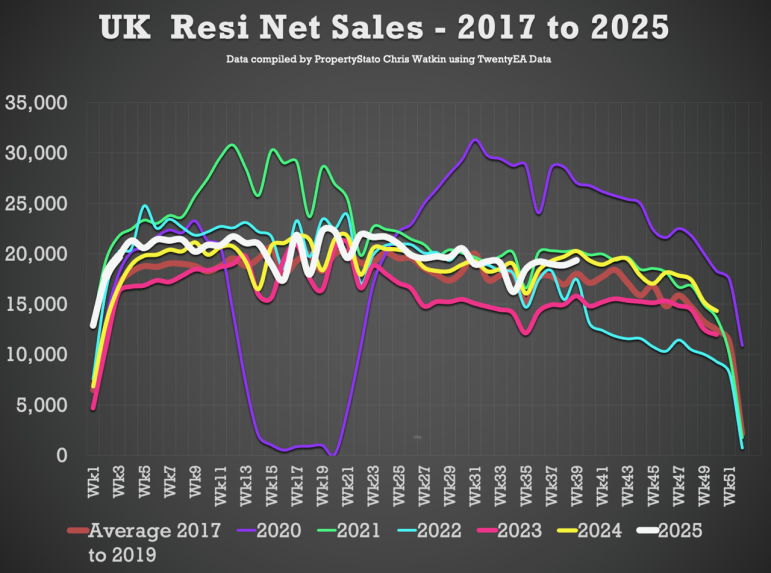
✅ Net Sales
19.4k net sales this week, up from 18.9k last week.
Nine-year Week 39 average: 19.4k.
Weekly average for 2025: 19.9k.
YTD: 777k, which is 4.5% ahead of 2024 (743k) and 10% above 2017–19 (706k).
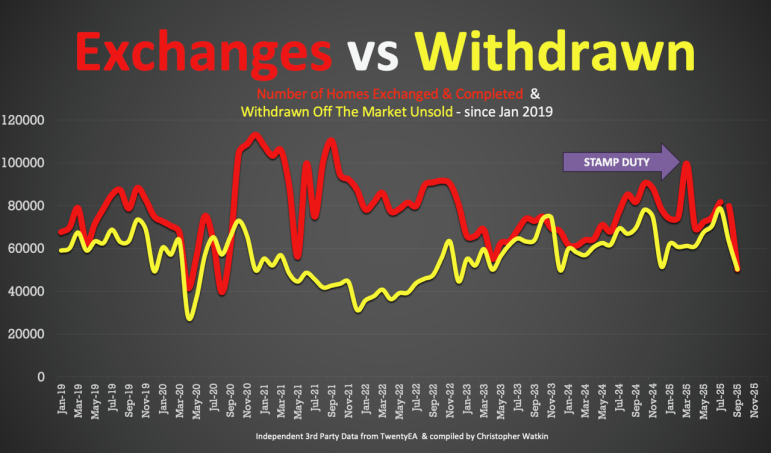
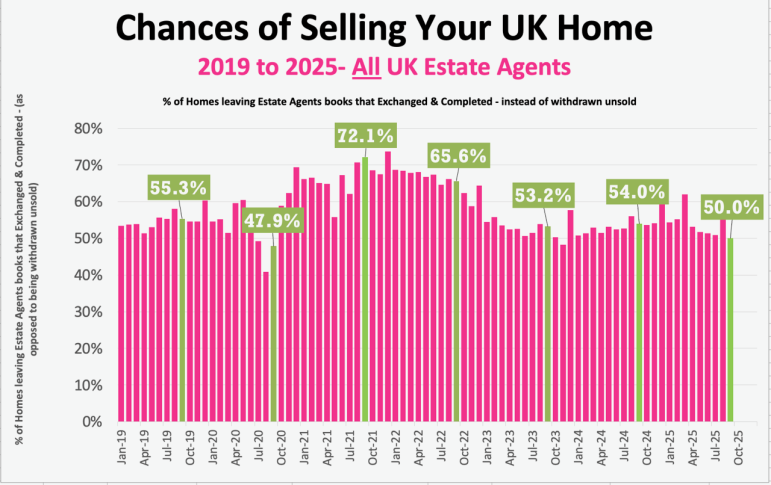
✅ Probability of Selling (% that Exchange vs withdrawal)
Preliminary September Stats : 50% of homes that left agents’ books exchanged & completed. (Note this will change as more September stats come in in throughout October)
August :55.8% / July: 50.9% / June: 51.3% / May: 51.7% / April: 53.2%.
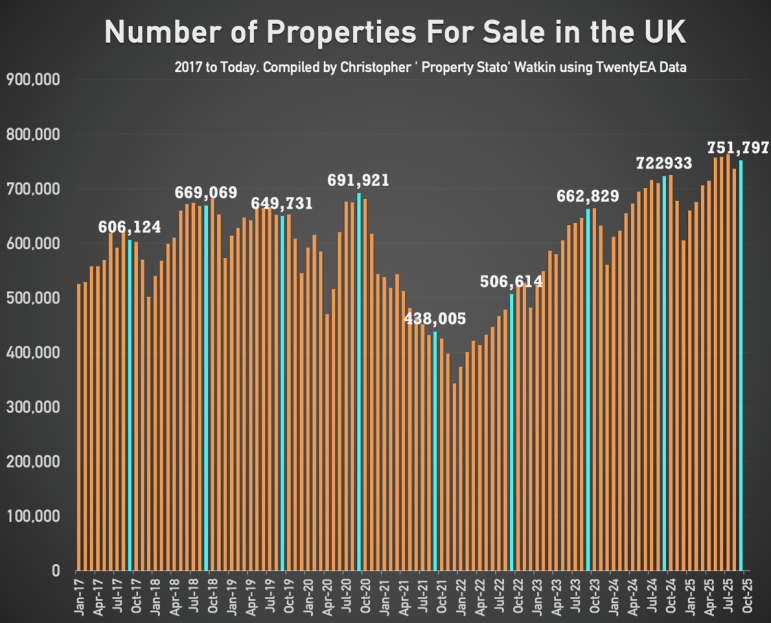
✅ Stock Levels
751k homes on the market at the start of October, 4% higher than October 2024. (723k)
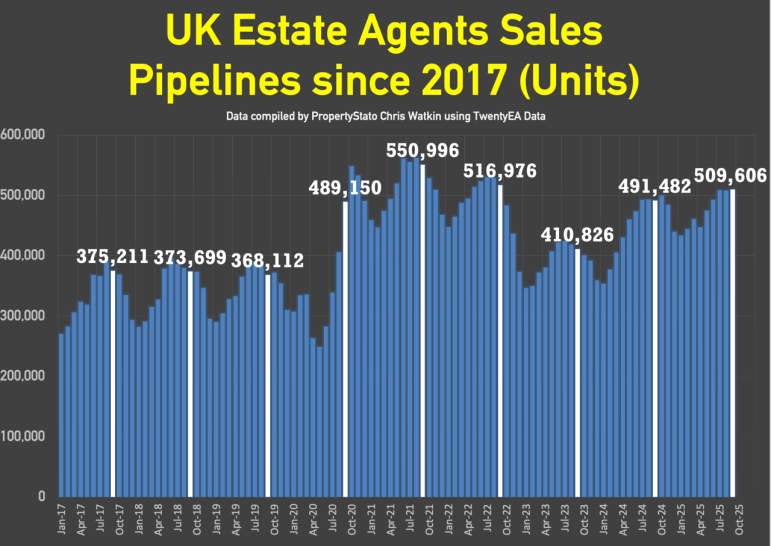
510k homes in sales pipeline on the 1st October, 2% higher than 12 months ago.
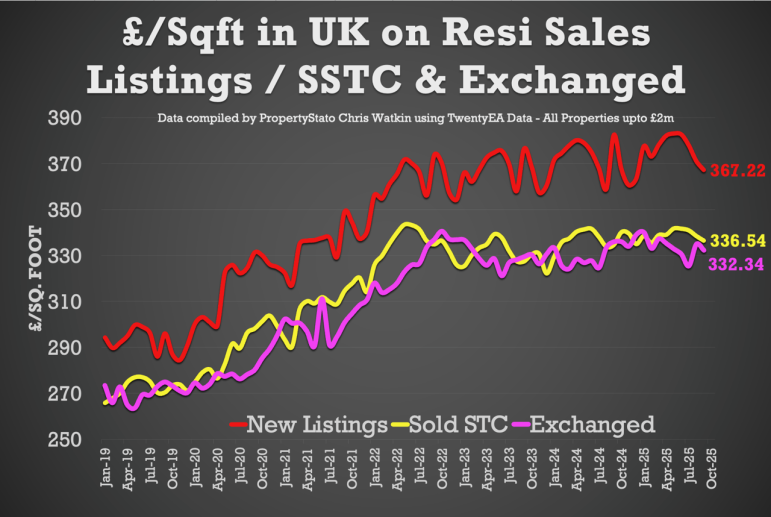
✅ House Prices (£/sq.ft)
October 2025 agreed sales averaged £336.54 per sq.ft.
✅ Local Focus on the Show:
St Albans
✅ Summer Analysis of London vs rest of the UK
⭕ January to July 2025
London
• Average asking price of new listings, £946k
• Average price of sales agreed, £769k
• Weekly averages, listings 3,195, sales agreed 1,508
• Sales-agreed to listings ratio, 47.2%
Rest of UK, excluding London
• Average asking price of new listings, £394k
• Average price of sales agreed, £341k
• Weekly averages, listings 33,622, sales agreed 25,034
• Sales-agreed to listings ratio, 74.5%
⭕ August and September 2025
London
• Average asking price of new listings, £921k
• Average price of sales agreed, £760k
• Weekly averages, listings 2,993, sales agreed 1,222
• Sales-agreed to listings ratio, 40.8%
Rest of UK, excluding London
• Average asking price of new listings, £381k
• Average price of sales agreed, £339k
• Weekly averages, listings 31,108, sales agreed 23,462
• Sales-agreed to listings ratio, 75.4%
⭕ What changed in Aug–Sep versus Jan–Jul
London
• Sales-agreed to listings ratio down 6.4 percentage points
• Sales agreed per week down 19.0%
Rest of UK
• Sales-agreed to listings ratio up 0.9 percentage points
• Sales agreed per week down 6.3%
⭕ What it means
Volumes softened everywhere in late summer, however London’s fall in sales agreed was much larger, and its conversion from listings to sales slipped further. The rest of the UK held conversion steady and protected more of its sales volume. Clear late-summer divergence.


